


About a month ago I went over the International Oil and Gas activity. Today I'll take a high level look at the US, with the focus being on rig count. It's quite topical as oil has now come back into fashion for investors. I'm going to use WTIC as the benchmark for US oil.
For some additional background, I think this podcast with Todd Sullivan on The Contrarian Investor Podcast goes over the current landscape for US.
WTIC history
I was able to find some data going back to 1946. It's interesting to see how oil seems to trade sideways for a long period of time. Below is the average nominal price per year and in a logarithmic scale.

Taking a look at the inflation adjusted price tells an interesting story. It looks like the inflation adjusted price has been the same for an entire generation.

70s boom
In the previous post I mentioned the 1970s oil boom. Looking at just the US in isolation, the rig count in the late 70s/early 80s dwarfs all the other time periods.

Of course, rigs have advanced immensely over the last couple decades. 100 rigs in the 1970s does not equal 100 rigs in the 2010s.
The boom of the 70s was related to several factors; US production peaked sometime in the 1960s, continual increase in consumption, the Arab oil embargo, Yom-Kippur War, and other factors all contributed to prolonged higher prices and increase in investment to discover and produce oil domestically.
Mid 1980s to 2000s
After the 1970s boom, oil was left for dead for about 15 years. You can see in the chart below that the price essentially went sideways from 1985 until 2000. The rig count remained under 1,000 for most of this time.

2000s
After the tech bubble and 9/11 marked the start of a gradual recovery in oil activity. The US rig count went from around 1,000 in 2003 to nearly 2,000 in 2008 right before the GFC.
Despite the increase in investment in the 2000s, the production of oil slowly declined.
https://www.eia.gov/todayinenergy/detail.php?id=43015
FWIW I remember many experts calling for $200 oil when I was first getting into picking stocks in 2006/07. This was during the last commodity boom when we thought China was just going to consume everything.
GFC
Of course, oil crashed hard during the GFC. Oil went below $40 (from over $140) for the first time in 5 years. Though, it bounced back above $60 in short order.
Shale boom
The shale boom really started to move the needle on production after the GFC. There was a ton of interest around shale and the sharp increase in production. In a very short time, the US went from an importer to an exporter of oil. The price remained in the $80-100 from 2011 to the end of 2014.

2015/16 Bear Market
The ever increasing supply, strong US dollar, stable OPEC production, removal of sanctions against Iran, weaker than expected global demand all led to a sharp contraction in price. Oil went back under $40 for the first time since the GFC. This was a very sharp contraction in activity.
Late 2016 to 2020
The stabilization in price eventually led to a rebound, although muted. You can see the 2017/18 rig count wasn't much more than half of the rig count from 2011-2014. As an investor, I noticed a more conservative tone from the producers when allocating capital to drilling and exploration relative to other cycles.
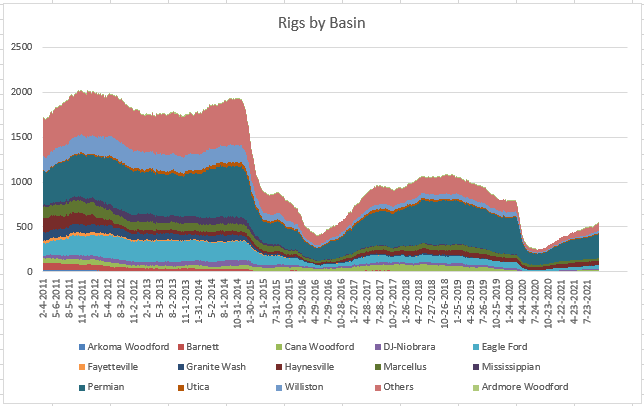
It's interesting to see the different regions and how they all contribute to the overall rig count.
Today
After the sharp decline in demand due to the covid lockdowns (which resulted in negative prices temporarily), we are now in phase of higher prices. There is so much noise with covid variants, lockdowns, supply chain challenges, OPEC spare capacity, EV transition, political challenges, etc. that producers with long term reserves have prioritized cleaning up their balance, paying dividends and buying back shares over expanding existing production.

After the covid lockdowns, there has been a very slow increase in rig count. Though the rig count has essentially doubled year over year, it's only at the same level as the previous cycle's trough.
When looking at the rig count when oil is $80, we have a long way to go before activity gets back to prior levels. Having said that, I'm not sure that is our path. President Biden has put a halt on new leases for drilling on federal lands. Specific regions are affected more than others, for example the Permian is less affected than others. As well, the Keystone XL pipeline was halted as the permits were revoked. This additional layer of complexity by the current government(s) make allocating capital to anything hydrocarbon related murky at best. High prices may not be enough to get the large producers to open up the capital budgets.
I have no idea how this all pans out eventually. At the same time that we are having more and more political pressure to lower hydrocarbon production and transition to EV; consumers, businesses, and politicians are once again remembering how much we depend on oil. My sense is that the risk is to the upside from an activity standpoint.
Anyone have thoughts on this?
Dean